VS Code Extension
Chat panel, guided templates, editor panel, file output, and extension configuration.
The VS Code extension is the Damira interface for VS Code: a chat panel, guided templates, a full editor panel for long-form output, and file attachment for your knowledge base. It also runs in Cursor — but if you work in Cursor, start with the Cursor plugin. It's the lighter path.
Chat Panel
The chat panel lives in the VS Code sidebar. Open it by clicking the Damira AI icon or using Cmd+Shift+P → "Damira AI: Open Chat".
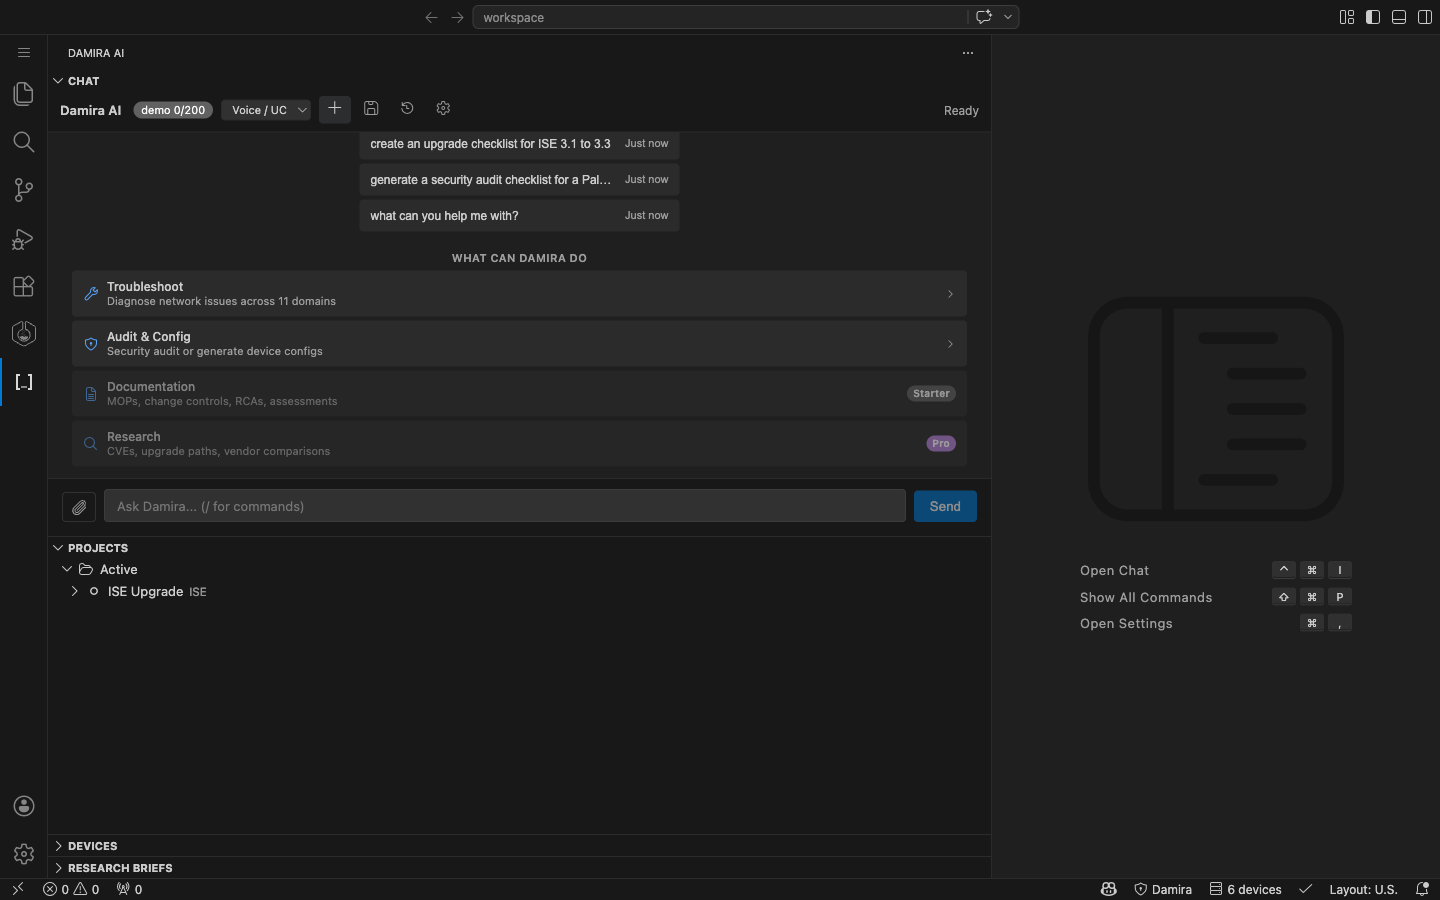
Ask questions in plain English. The assistant identifies the network domain, pulls relevant documentation, and responds with structured diagnosis or documentation.
Multi-Tab Chat
You can open multiple chat tabs simultaneously (up to 8). Each tab maintains its own conversation and project context. Tabs persist across VS Code restarts.
Use the + button in the chat panel header to open a new tab. This lets you work on multiple issues at once — troubleshoot a BGP problem in one tab while generating an upgrade spreadsheet in another.
Guided Templates
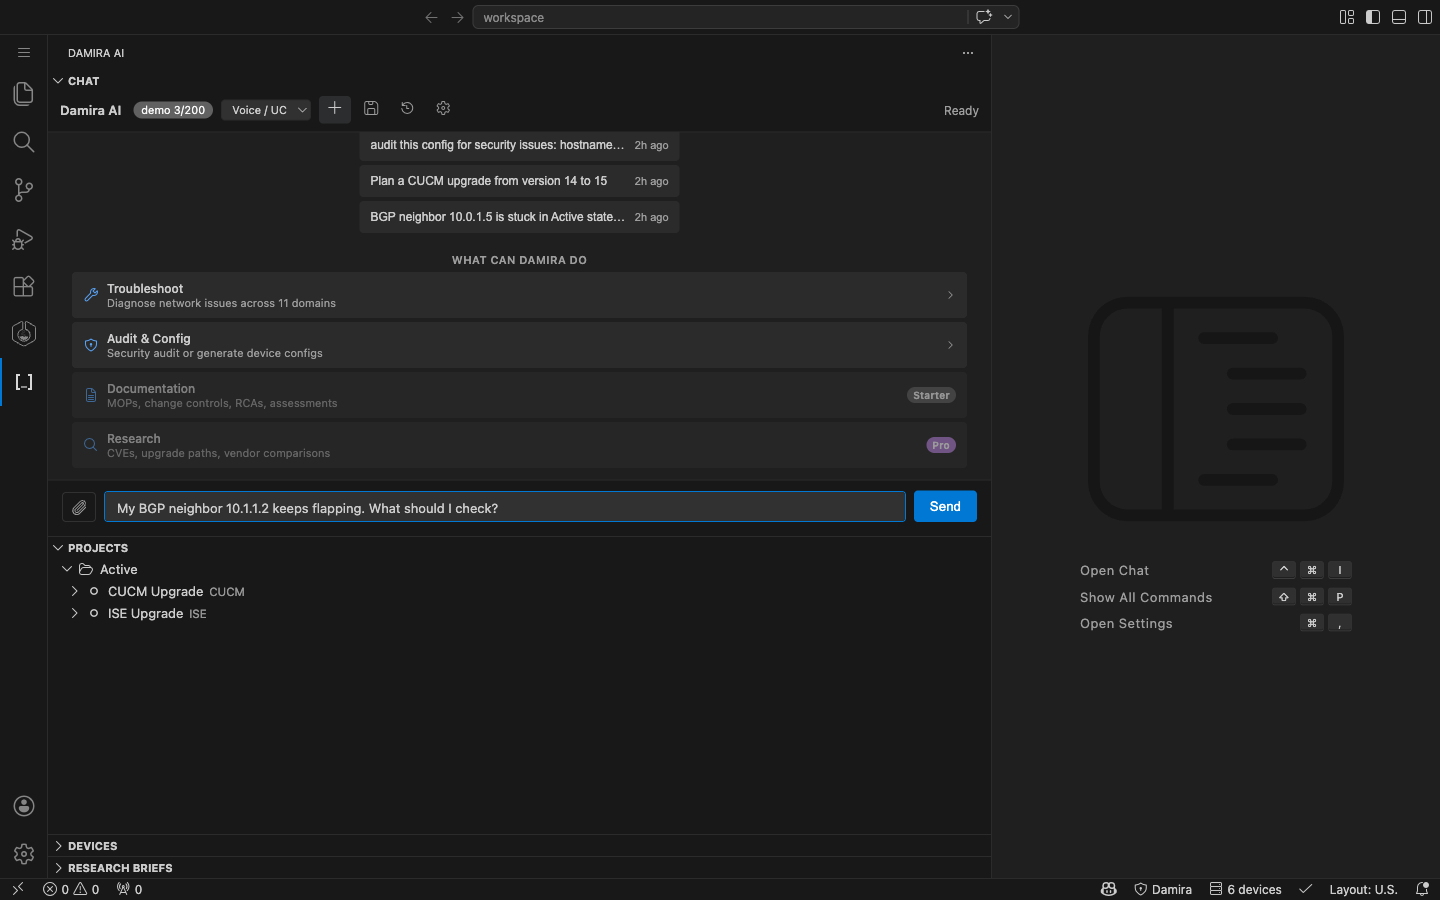
Click New from Template to use pre-built workflows:
- Troubleshoot — Describe a network issue, get step-by-step diagnosis
- Generate Config — Specify requirements, get interface or routing configs
- Create MOP — Describe a change, get a method of procedure document
- Security Audit — Paste a device config, get a security findings report
- Research — Ask about CVEs, vendor releases, or upgrade paths
Templates pre-fill the input with guided fields so the assistant has the context it needs to give you a useful answer on the first try.
Editor Panel
For long-form output (MOPs, runbooks, research reports), use the full editor panel:
Cmd+Shift+Enter (Mac) or Ctrl+Shift+Enter (Windows)
This opens the chat in a full editor tab alongside your files, with more room for structured documents and tables.
File Output
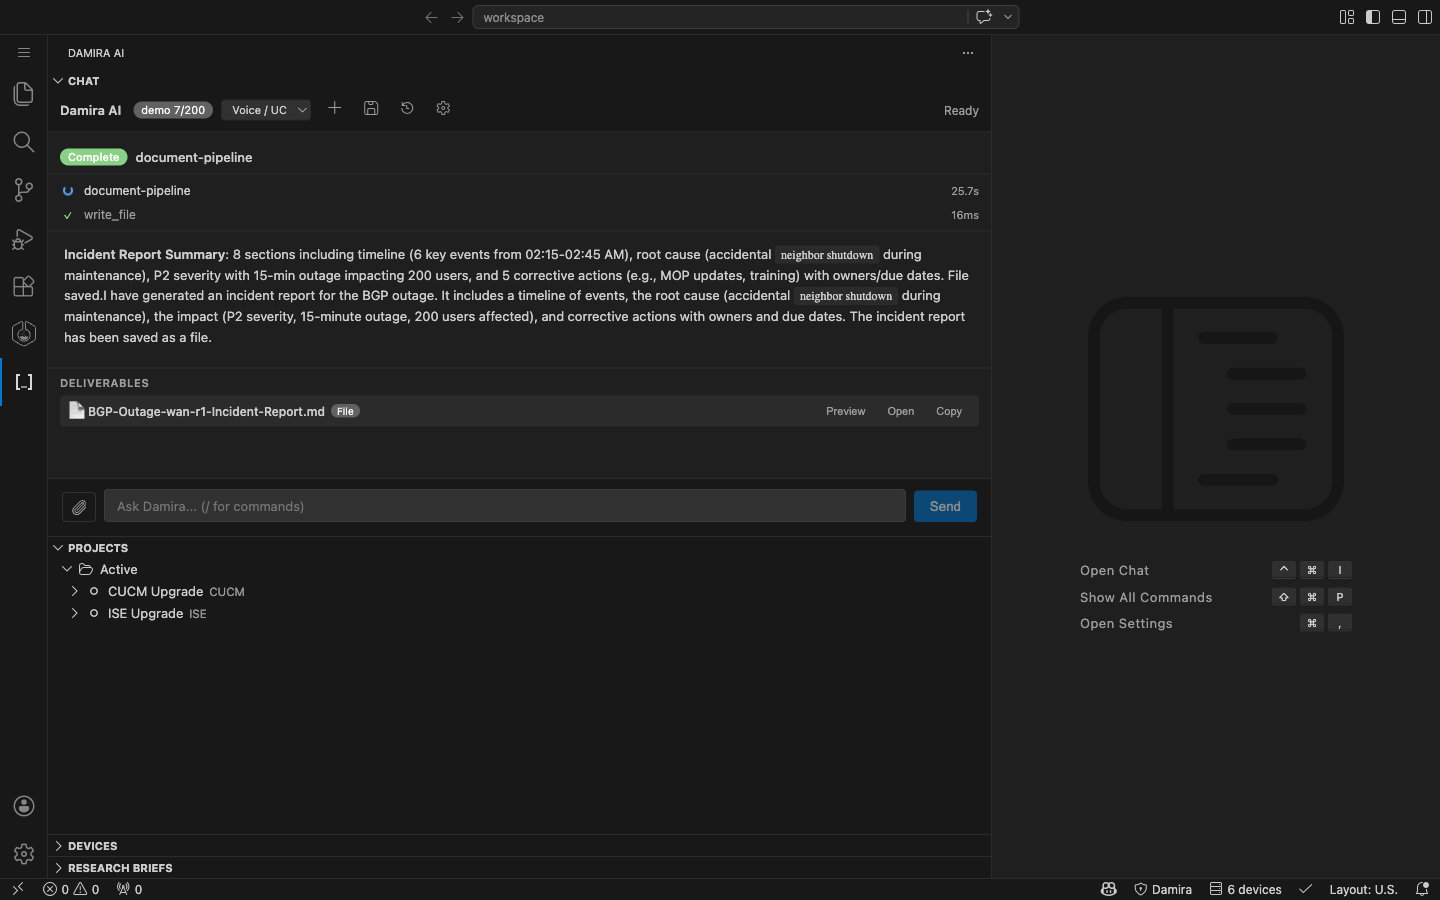
When the assistant generates a deliverable (spreadsheet, MOP, report), a Deliverables section appears in the chat with buttons to Preview, Open, or Copy each file.
- Spreadsheets (
.damira.json) open in an interactive table editor where you can sort, filter, and edit cells - HTML files (MOPs, change controls, runbooks) open in your default browser with print-ready formatting
- Markdown files open in VS Code's markdown preview
- Excel files (
.xlsx) open in your system spreadsheet app
Files are automatically saved to your output folder organized by type (docs/, research/, reports/, configs/).
Background Tasks
Long-running operations like deep research and spreadsheet generation run in the background. A progress indicator auto-polls for status updates, and you receive a notification when the task completes. You can continue chatting in another tab while a task runs.
Project Files
Files generated inside a project are saved to damira-output/projects/{project-name}/ and appear in the project tree in the sidebar. Click any file in the tree to open it — spreadsheets open in the interactive editor, markdown opens in preview.
File Attachment
Click the paperclip icon in the chat input to attach files from your machine. Supported formats:
- PDF, Markdown, Plain Text
- Word documents (.docx)
- Spreadsheets (.csv, .xlsx)
Attached files are added to your personal knowledge base. The assistant references them in future answers. See Knowledge Base for details.
Integration Picker
The Settings panel includes a category-based integration picker for connecting your monitoring and ticketing tools. Open Settings from the gear icon in the chat panel header.
Available integrations:
| Category | Tools |
|---|---|
| Monitoring | Prometheus, Grafana |
| Log Management | Loki |
| Ticketing | ServiceNow |
Check the boxes for the tools you use and fill in connection details (URLs, credentials). Damira only loads tools for integrations you've configured. See Monitoring Integration for setup details.
Devices Sidebar
After connecting Prometheus, you can discover devices from your monitoring targets:
Use the Command Palette → "Damira: Discover Devices from Prometheus"
Discovered devices appear in the Devices panel in the sidebar with hostname, IP, and status. Devices refresh automatically after each discovery and are available as context in all conversations.
Configuration
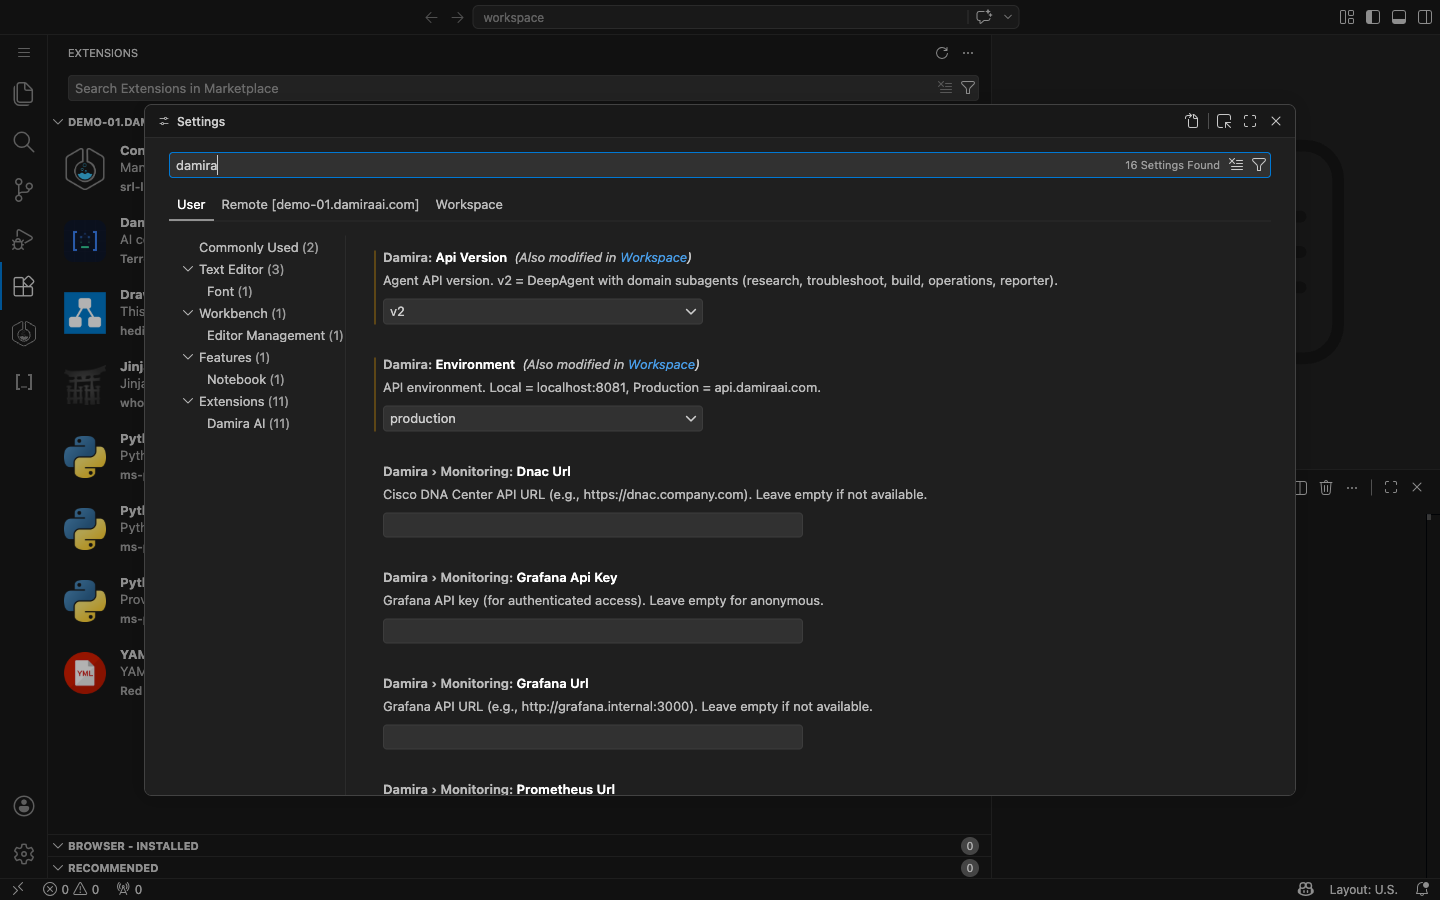
Open VS Code Settings (Cmd+,) and search for Damira to configure:
| Setting | Description |
|---|---|
| API Key | Your API key from the dashboard |
| Environment | Production (default) or Development |
| Team Slug | Your organization slug for team knowledge base |
| Monitoring | Prometheus URL, Grafana URL, Loki URL |
| ServiceNow | Instance subdomain, username, password |
| Output Folder | Where generated files are saved (default: damira-output/) |
Extension Commands
Open the Command Palette (Cmd+Shift+P) and search for "Damira":
| Command | Description |
|---|---|
| Open Chat | Open the chat sidebar panel |
| Open Editor Panel | Open chat in a full editor tab |
| New Chat | Clear conversation and active project context |
| Set API Key | Configure your API key |
New Chat Behavior
Clicking New Chat (or the + button) clears the current conversation and deactivates any active project. This prevents workflow cross-contamination — a new PAN-OS troubleshooting session won't accidentally resume your in-progress CUCM upgrade.
To resume a project, click it in the Projects panel in the sidebar.